

6 Nov 2026
Work in Progress: Why More Orders on the Floor Slow Deliveries
Output stays at 100 units per day while WIP rises from 300 to 600. Calculate why average flow time doubles and how a 400-unit WIP target changes the plan.
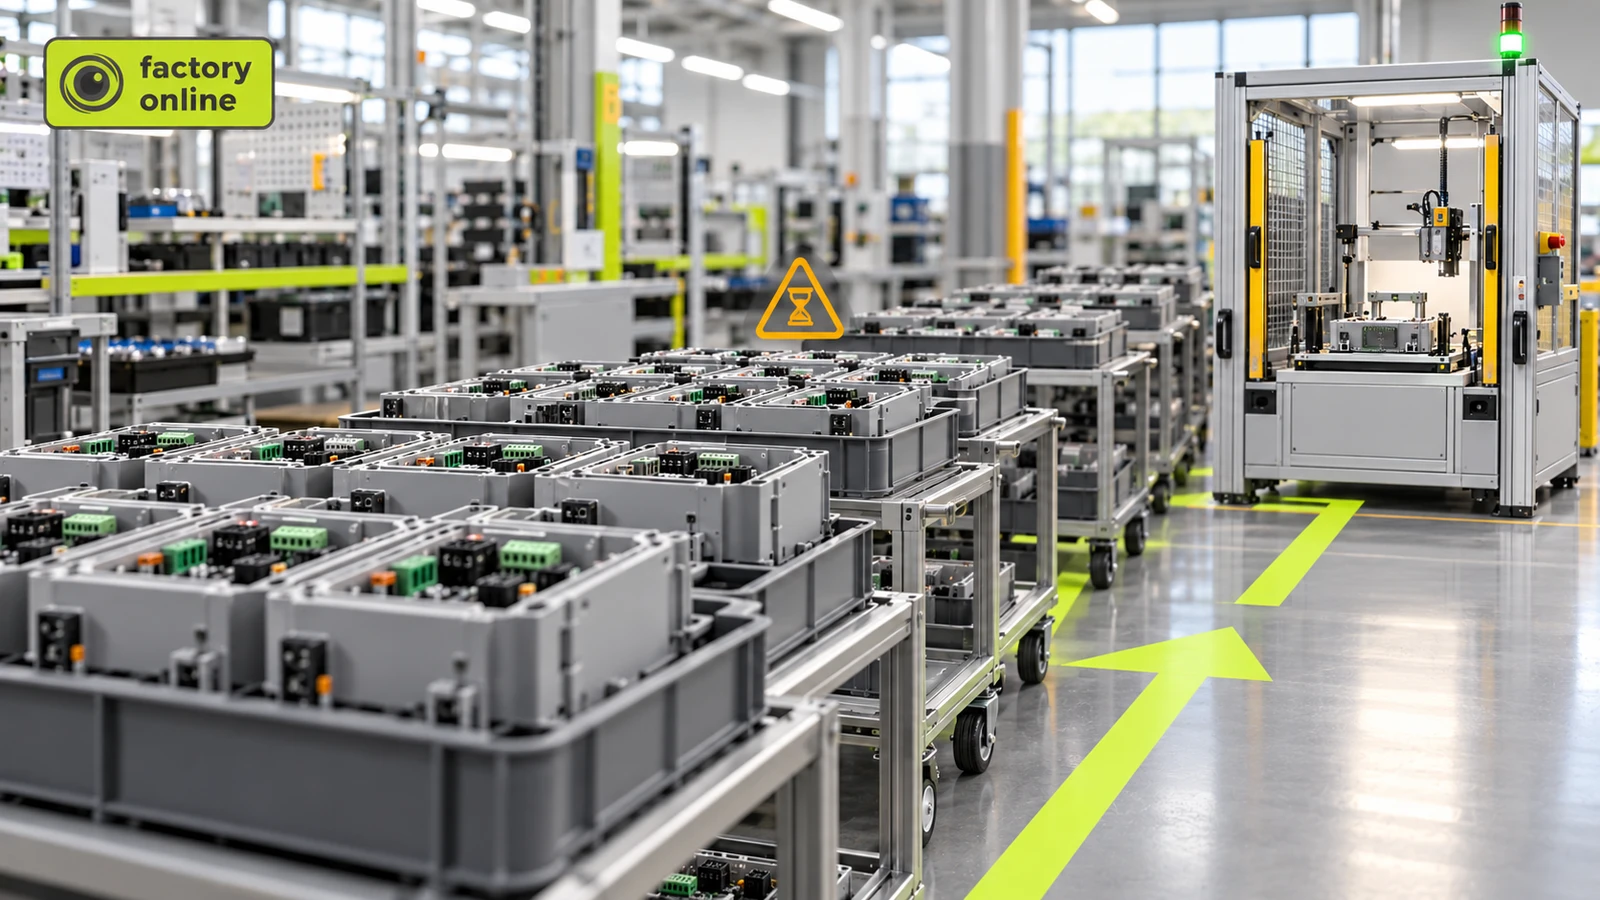
A production line completes 100 units per day. The factory increases the number of orders released to the floor, hoping to keep every workstation busy. Output remains at 100 units per day, but orders now spend twice as long in production.
Nothing has happened to the equipment's processing speed. The factory has simply increased the amount of unfinished work.
Work in progress (WIP) is inventory that has entered production but has not yet become finished goods. When throughput stays constant, increasing average WIP increases the average time each unit spends in the production system.
How WIP affects manufacturing lead time
Consider a factory assembling industrial control units.
The production area completes an average of 100 good units per working day.
Initially, the factory has an average of 300 units in progress across assembly, testing, and intermediate queues.
Little's Law connects average WIP, throughput, and flow time in a stable production system:
WIP \= Throughput × Flow time.
Rearranging:
Flow time \= WIP ÷ Throughput.
For the initial production system:
300 ÷ 100 \= 3 working days.
The average unit spends 3 working days between entering and leaving the production area.
Now management releases more manufacturing orders to keep the assembly stations busy.
Average WIP increases to 600 units, but the final testing station still limits throughput to 100 good units per day.
The new average flow time becomes:
600 ÷ 100 \= 6 working days.
The factory has doubled its average WIP and doubled its average production flow time without increasing daily output.
Why adding more orders does not increase output
The final testing station can complete only 100 units per day.
Releasing another 300 units into assembly does not change that limit. It creates a larger queue ahead of testing.
The additional units occupy floor space, require tracking, and make it harder for planners to see which orders are closest to completion.
The result is more unfinished inventory, not more finished products.
Imagine a coffee shop where the barista can prepare 30 drinks per hour. Allowing 60 customers to place orders immediately does not increase the barista's capacity. It increases the number of people waiting.
The same principle applies to a manufacturing line with a constrained workstation.
Myth: More work in progress means higher productivity
A busy workstation is not necessarily improving the output of the entire production system.
In the example, doubling WIP from 300 to 600 units leaves throughput unchanged at 100 units per day.
The extra 300 units create 3 additional working days of average flow time.
The factory is carrying twice as much unfinished inventory for the same daily production output.
The important distinction is between local equipment utilization and total system throughput.
Should the factory reduce WIP immediately?
Reducing WIP is useful only if the remaining work can keep the constraint supplied.
If the factory releases too little work, the testing station may run out of units. Throughput could then fall below 100 units per day.
The planner should therefore identify the constrained operation, protect it from starvation, and control how much work is released upstream.
A practical starting point is to compare the current WIP level with the throughput and flow time the factory needs.
For example, if the target average flow time is 4 working days at 100 units per day:
100 × 4 \= 400 units of average WIP.
That is 200 units less than the current 600-unit level.
The 400-unit figure is a planning target for average WIP, not a guarantee that every order will finish within four days. Variability, routing differences, and bottleneck availability still affect individual completion times.
What planners should measure
The most useful comparison is between average WIP, actual throughput, and average flow time over the same period.
In factory.online, manufacturing orders, job orders, and output confirmations help planners see production progress. Finite-capacity scheduling can show how work is distributed across resources and where queues are likely to form.
When orders spend longer waiting than being processed, let's examine how your production schedule handles unfinished work.