
7 Sep 2026
Manufacturing Optimization Starts at the Bottleneck
Three machines make 100, 60 and 80 units an hour. The plant makes 60. See why an hour lost at the bottleneck costs real money and an hour saved elsewhere is a mirage.
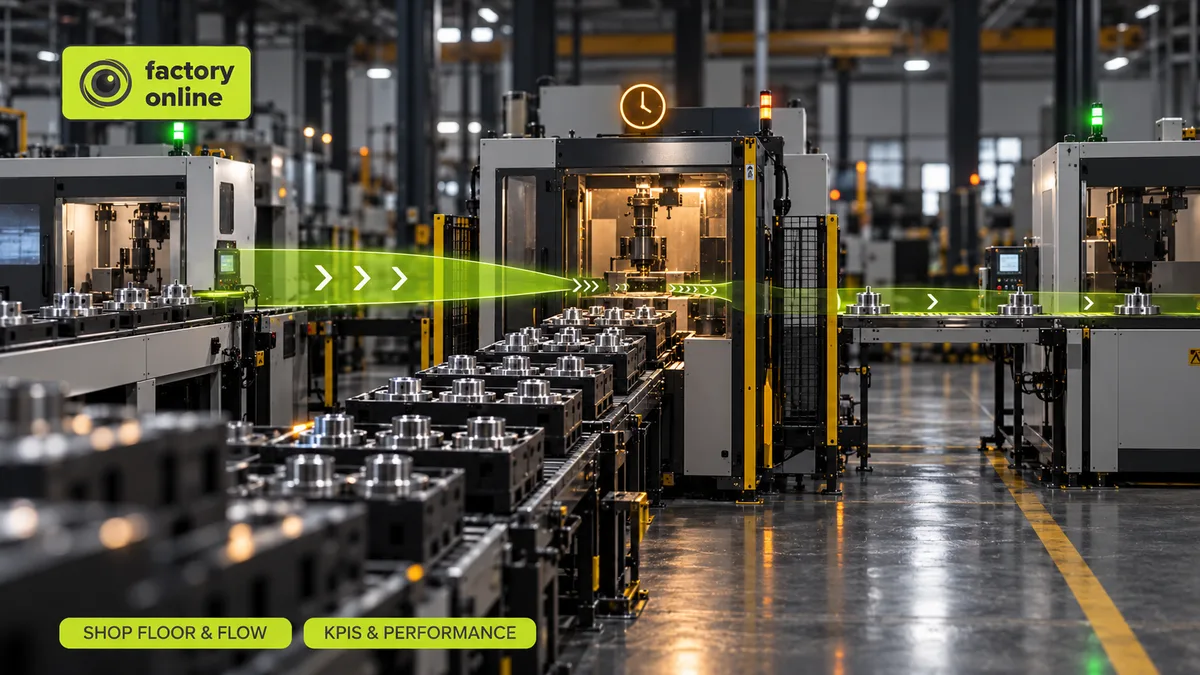
Three machines stand in a row. The first can process 100 units an hour, the second 60, the third 80. Every unit goes through all three. How many units an hour does the plant make?
Sixty. Not 80, the average. Not 100, the fastest. The line moves at the pace of its slowest step, and everything else is extra capacity that cannot reach the customer. That one idea is where manufacturing optimization should start: improving the output, cost or lead time of the whole plant by finding the one resource that limits it, the bottleneck, and organizing everything else around it. Improving any other machine first usually changes nothing on the shipping dock.
The Goal, and why a novel changed factories
In 1984 Eliyahu Goldratt, an Israeli physicist, published The Goal, a business book written as a novel. Plant manager Alex Rogo has three months to save his factory. On a weekend scout hike he notices that the whole troop can only walk as fast as Herbie, the slowest boy, and that the gaps in the line keep growing no matter how fast the kids at the front march. The factory, he realizes, works the same way.
The idea became the Theory of Constraints (TOC). Its core fits in one sentence: every system has at least one constraint, and the output of the system is the output of the constraint.
The everyday version is a highway where three lanes narrow to one. Widening the three-lane part does nothing for your commute.
A worked example: 100, 60, 80
Call the machines cutting (100/h), welding (60/h) and painting (80/h), and run them for an 8-hour shift. Each unit brings in $50 of throughput: sales price minus material cost.
- Plant output: 60 × 8 = 480 units per shift, or $24,000 of throughput.
- Lose one hour at welding (a breakdown, a late operator, a long changeover): the plant makes 420 units. That hour cost 60 × $50 = $3,000, gone for good.
- Lose one hour at cutting: cutting can still make 700 units in the remaining 7 hours, far more than welding can take. Plant output stays at 480. Cost of the lost hour: zero, as long as a few parts wait in front of welding.
- Save one hour at painting with a clever improvement: painting was already idle 2 hours a shift, waiting for welding. Now it is idle 3. The saving is a mirage.
Goldratt's line is worth memorizing: an hour lost at the bottleneck is an hour lost for the entire system; an hour saved at a non-bottleneck is a mirage.
Myth: every machine should run at 100%
This is where the busiest machine starts lying. Cutting in our example can run flat out, and its utilization report will look wonderful. But it makes 100 units an hour for a welder that takes 60. The other 40 an hour pile up: 320 units of work in progress by the end of the shift, all bought, cut, stored and waiting. The busiest machine on the report is not the most important one. It is just the one making the biggest pile.
A non-bottleneck should sit idle part of the time. That idle time is not waste. It is the spare capacity that lets it catch up after a disruption and keep the bottleneck fed. The cost of the pile is spelled out in WIP and Little's Law: more work in the system means longer lead times, not more output.
Manufacturing optimization in five focusing steps
TOC turns the idea into a routine:
- Identify the constraint. Look for the resource with a permanent queue in front of it and idle machines after it. On paper, rough-cut capacity planning shows which work center is loaded above 100%, in hours, not units.
- Exploit it: squeeze every minute. If welding stops 45 minutes a shift for breaks, stagger the breaks. That is 0.75 × 60 = 45 more units a shift, $2,250, for free. Shorter setups on this one machine are where changeover optimization pays most.
- Subordinate everything else. Release work at the pace of the constraint, not the pace of the fastest machine. Keep a small buffer in front of welding so it never starves.
- Elevate it. Only now spend money: a second welder, a shift more, an outside partner.
- Repeat. Once welding makes 90 an hour, painting at 80 is the new constraint.
Where the bottleneck hides
In a straight line, the bottleneck is easy to spot. In a plant with many routings it moves with the product mix: this week's orders may load the press, next week's the test bench. That is why job shop scheduling is harder than it looks. Measure OEE on the constraint first; a 5-point gain there can be worth more than 20 points on a machine that waits for work.
FAQ
Is the bottleneck always the slowest machine? It is the resource with the least capacity relative to the load. A fast machine that every product visits can be the constraint.
Can a bottleneck be outside production? Yes. Inspection, a single setter, a supplier or even the sales team can be the constraint.
How it looks in factory.online
In factory.online, RCCP shows the load per work center for the coming weeks, so the planner sees welding at 125% while cutting sits at 70%. The finite-capacity Gantt then schedules work around the welder's real hours, and a planning scenario can test what a second shift on that one machine would do to late orders.
kafaa.ai addresses jobshop scheduling and sequencing under production constraints. It can support the comparison of alternatives where machine availability, setup losses and delivery priorities need to be considered together.
If your utilization reports look great and deliveries don't, book a demo and bring the report.