

20 Apr 2026
Safety Stock and Reorder Point: Why the Bin Still Ran Empty
The reorder point was 280 and the bin still ran empty. Work through the safety stock formula with real numbers and learn why cycle service level and fill rate are different promises.
The reorder point for M8 bolts was 280. On Wednesday the bin hit 280, and the buyer ordered the same day. The supplier usually needs five working days. On Friday of the next week the bin was empty, assembly was waiting, and the truck was still on the highway. Nobody broke the rule.
Safety stock is the extra inventory you keep to cover the gap between average and actual demand (and supply) while you wait for replenishment. The reorder point is the stock level that triggers a new order: expected demand during the lead time plus safety stock. To see why the bin still ran empty, you need both numbers and one idea most people skip.
How the reorder point is calculated
The bolts are used at an average of 40 a day. Lead time is 5 working days. So while you wait for the order, you expect to use 40 × 5 = 200 bolts. That is the lead time demand.
The old rule added 80 on top, "two days of usage, just in case." Reorder point = 200 + 80 = 280. Most safety stocks are set exactly like that.
The safety stock formula, with real numbers
The textbook version for demand swings is:
SS = z × σ × √LT
- σ is the standard deviation of daily demand. Over the last 60 working days the bolts averaged 40 a day with σ = 12, so most days fell between 28 and 52.
- LT is the lead time in days: 5.
- z is the service factor. z = 1.65 means you want no stockout in 95% of replenishment cycles.
√5 ≈ 2.24, so the typical wobble over the whole lead time is 12 × 2.24 ≈ 26.8 bolts. Why not 12 × 5 = 60? Because busy days and quiet days partly cancel out. Five bad days in a row are rare. Then 1.65 × 26.8 ≈ 44.
So demand variation alone calls for about 44 bolts of safety stock, not 80. That makes the empty bin even stranger, until you notice what the formula assumes: the lead time is always exactly five days. This time the supplier needed seven. At a perfectly normal 40 a day, 7 × 40 = 280. The whole reorder point was used up by two extra days, not by a busy week.
If the supplier's lead time wanders by about a day (σ of 1 day), the fuller formula adds that risk: SS = 1.65 × √(5 × 12² + 40² × 1²) = 1.65 × √2,320 ≈ 1.65 × 48.2 ≈ 80. The old guess was roughly right after all. The lesson is the one to repeat to a colleague: for most purchased parts, an unreliable supplier costs you more buffer than unpredictable demand. The same is true for parts you make yourself, where manufacturing lead time is mostly queue time and moves a lot.
Cycle service level vs fill rate
"95% service" hides two very different promises.
Cycle service level is the share of replenishment cycles with no stockout. 95% means one cycle in twenty is allowed to run short. The bolts are ordered 400 at a time, about 10 days of use. With 250 working days, that is 25 cycles a year, so you should expect a stockout about once a year. That Friday was the rule working as designed.
Fill rate is the share of demand served straight from the shelf. On that Friday the line missed about one day of bolts, 40 pieces. Yearly use is 40 × 250 = 10,000, so the fill rate was 9,960 / 10,000 = 99.6%. Same year, same bin: 96% cycle service level (24 of 25 clean cycles), 99.6% fill rate. When someone asks for "98% service," ask which one they mean. The answer changes the buffer a lot.
Think of it like leaving for the airport. You don't plan for the worst traffic jam of the decade. You plan for a bad day and accept that once or twice a year you will run to the gate.
Myth: "After a stockout, raise all the minimums"
Every empty bin creates pressure to raise buffers everywhere. Going from 95% to 99% moves z from 1.65 to 2.33, which is 41% more safety stock on every item. For the bolts that is about 33 extra pieces, which costs almost nothing. But if your plant holds $450,000 of safety stock across 1,500 items, the same move ties up about $185,000 more cash, mostly in items that never caused trouble.
Spend the protection where it pays: cheap parts that stop a line get a high z, and expensive, slow parts get a lower one. And fix the supplier whose lead time wanders, because that is where the buffer really goes. The bigger picture is in inventory management for manufacturers.
When a reorder point is the wrong tool
Reorder points suit steady consumption across many jobs: fasteners, packaging, consumables. They fail for lumpy, order-driven parts. If one order needs 300 castings on the 14th, a daily average can't see it coming. Those parts belong in MRP. If demand is too volatile for either approach, DDMRP places deliberate buffers at a few chosen points instead of everywhere. And when a bin does run empty, a new purchase order is often not the best answer: see six shortages that don't need a new purchase order.
What the planner sees in factory.online
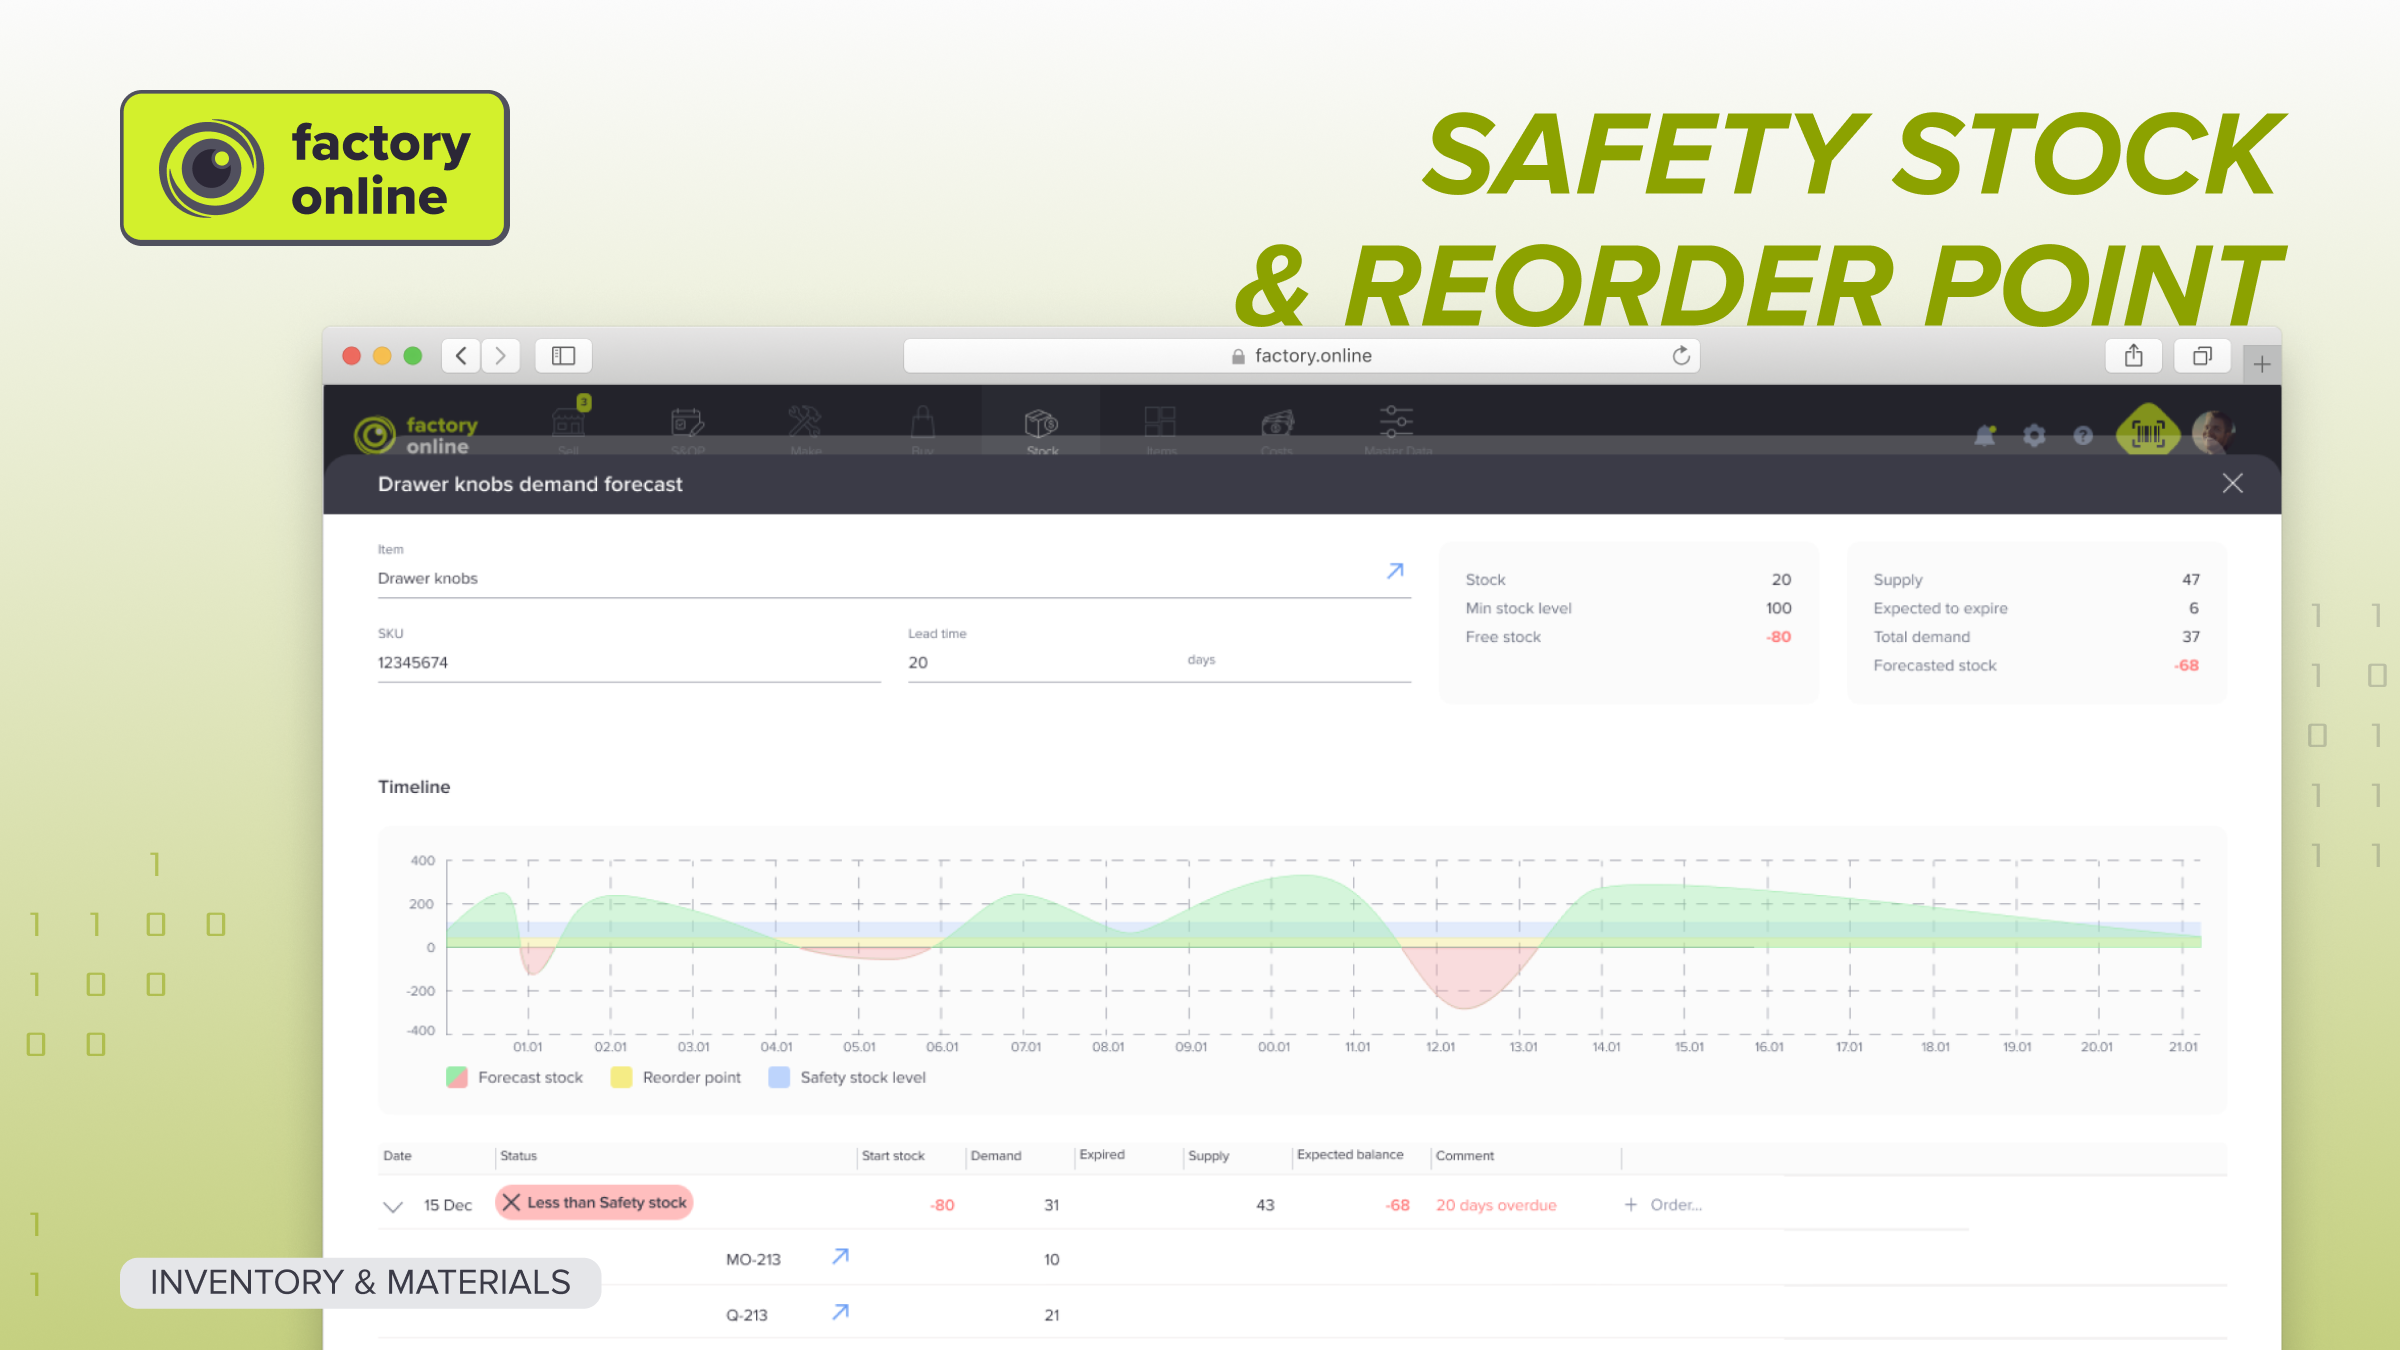
In factory.online, the bolts' stock by location, the open purchase order with its date and the MRP shortages linked to the assembly orders that consume them sit together. When the supplier's date moved from Wednesday to Friday, the planner would have seen which assembly orders were exposed two days before the bin ran dry, not on the morning it did.
If your buffers were set by someone who left the company years ago, book a demo and bring a few of those items with you.